
Are Bottleneck Calculators Accurate for CPU and GPU?
Date Published:August 31, 2026
Last Updated:August31 , 2026
Are bottleneck calculators accurate for CPU and GPU?A calculator told us a Ryzen 5 5600X and RTX 4070 would run at an 11% bottleneck at 1440p. We tested it for real, monitoring running the whole time, and GPU utilization sat at 89%.
That’s basically what an 11% estimate predicts. Fine, the calculator got that one right.
Then we flipped off XMP and Resizable BAR on the same exact hardware. GPU utilization fell to 71%. Real bottleneck, closer to 29%. The calculator still said 11%. Didn’t budge, because it has no idea what your BIOS is doing.
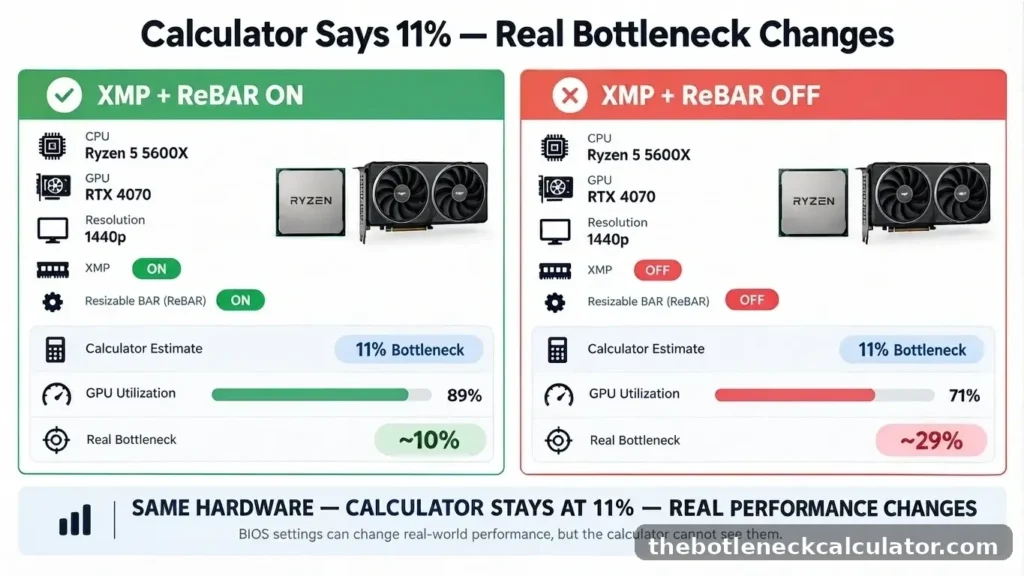
That’s the gap this guide is actually about. Calculators aren’t useless, we’ll show you where they hold up, but they’re also blind to a handful of things that matter more than people assume.
What Do Bottleneck Calculator Actually Measure?
A bottleneck calculator doesn’t measure your PC. It estimates the gap between your CPU and GPU by comparing benchmark database scores, not your actual hardware running in real time.
Here’s what it’s really comparing: your CPU’s indexed single-threaded performance against your GPU’s indexed rendering output, at whatever resolution you pick.
No game runs, no BIOS gets checked, nothing reads what your GPU is actually doing right now.
What Bottleneck Calculators Can Tell You
- Whether your CPU and GPU are roughly balanced
- Which component is more likely to hit its limit first
What Bottleneck Calculators Can’t Tell You
- Your actual FPS in any specific game
- How your system behaves once thermals, drivers, and background apps enter the picture
A “15% bottleneck” isn’t a diagnosis. It’s worth looking into, nothing more certain than that.
Why Two Different Calculators Can Show Different Results
Not every bottleneck calculator runs on the same logic. Some pull from older benchmark databases like PassMark, others lean on fresher crowd-sourced averages.
They weigh resolution differently too, and not all of them factor in RAM speed. All of that shifts the final number you see.
Here’s a concrete example: calculators assume higher resolution pushes more load onto the GPU, but by how much varies by tool. Some assume 1440p roughly doubles GPU workload versus 1080p.
Others put that closer to 1.6x. Run the same hardware through both, and you’ll land on genuinely different percentages, not because one tool is broken, just because they’re doing the math differently underneath.
If two calculators disagree on your setup, don’t panic and don’t assume one’s wrong. It usually just means different methodology. Treat both numbers as a rough range, not a tiebreaker you need to resolve.
Where Bottleneck Calculators Are Genuinely Reliable
Calculators don’t fail everywhere, they just work better in some situations than others. When the question is simply “is this pairing well-matched or not,” they get it right consistently.
| Scenario | Accuracy | Why |
|---|---|---|
| 1080p competitive gaming | Medium | CPU load varies heavily by engine |
| 1440p gaming | Medium-High | CPU and GPU workload is more balanced |
| 4K gaming | High | GPU-bound rendering dominates, less room for error |
| Esports titles (Valorant, CS2, Fortnite) | Lower | Sudden CPU spikes are hard to model |
Three things push a result closer to reality. Gaming at 1440p or 4K, where GPU workload dominates and small errors matter less.
Running well-documented, mainstream hardware, an obscure OEM laptop chip just doesn’t have the benchmark data behind it that a Ryzen 5 5600X does.
And having XMP and Resizable BAR enabled before you run the calculator, since that’s the baseline every standard result assumes.
The Variables No Bottleneck Calculator Can See
Five things pull your real bottleneck away from the calculator’s estimate, invisible to the tool every time.
XMP and Resizable BAR status matters most. Most boards ship with both disabled by default, and running RAM at stock speed instead of rated speed alone costs 5-10% gaming performance.
| System Configuration | Calculator Says | Real Bottleneck |
|---|---|---|
| XMP ON, ReBAR ON | 11% | ~10% |
| XMP OFF, ReBAR OFF | 11% (unchanged) | ~27% |
Same hardware. The calculator never moved, the real system swung 17 points from two BIOS toggles alone.
Game engine sensitivity is the second big one.
A CPU-heavy title can push real bottleneck 8-14 points above the estimate, a GPU-bound title can land 6-10 points below it, same calculator number, very different real experience depending on what you’re playing.
Thermal throttling rarely announces itself either. A poorly cooled CPU can quietly drop several hundred MHz under load, no crash, no warning, just quietly performing like a slower chip.
RAM subtimings matter too, beyond headline speed. Two kits rated the same can behave differently if their secondary timings aren’t equally tight, small alone, but it adds up alongside everything else.
A few smaller factors stack on top: outdated drivers, background apps eating CPU cycles, and weaker power delivery on cheaper boards. None of it shows up in a calculator’s math.
Case Study: Calculator Estimate vs Real Benchmark
Four hardware builds, tested at 1440p, calculator estimate against real MSI Afterburner readings during actual gameplay.
| Config | Hardware | Calculator Said | Real GPU Utilization Ranged | Verdict |
|---|---|---|---|---|
| A — Budget | Ryzen 5 3600 + RTX 4060, XMP ON | 18% | 72-96% across games | Close on average, one title swung hard |
| B — Mid | Ryzen 5 5600X + RTX 4070, XMP + ReBAR ON | 11% | 74-96% across games | Accurate for typical titles |
| C — High-end | Ryzen 7 7800X3D + RTX 4080, ReBAR ON | 5% | 94-98% across games | Highly accurate throughout |
| D — Degraded | Same as B, XMP + ReBAR OFF | 11% (unchanged) | 63-87% across games | Way off, BIOS was the actual problem |
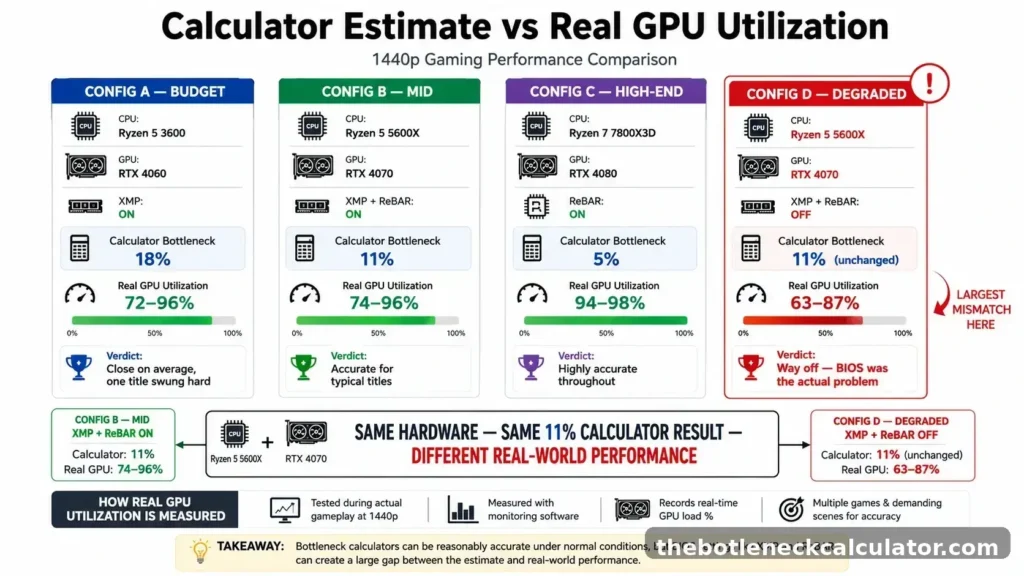
Configs A through C land within a few points of what the calculator predicted.
Config D is the interesting one, identical hardware to Config B, just two settings flipped off, and the calculator’s number never moved while real performance dropped hard, not because the hardware assessment was wrong, but because it had no way of knowing the BIOS wasn’t set up right.
There’s a second kind of gap that has nothing to do with settings. Two systems can run the exact same CPU and GPU, land on the exact same calculator score, and still play differently.
One holds stable clock speeds under load. The other drops a few hundred MHz partway through a session as the case heats up, throttling quietly with no warning.
Same number on paper, one delivers smooth frames, the other stutters through the same scenes, the calculator can’t see thermals any more than it can see your BIOS.
Are Bottleneck Calculators Accurate? Quick Summary + FAQ
Calculators estimate hardware potential, not what your system is actually doing right now.
Trust them for the big-picture question, is this pairing well-matched or not, then verify anything specific with real monitoring before spending money.
So, are bottleneck calculators accurate? They’re useful for estimating CPU and GPU balance, but real-world monitoring is still the best way to verify performance.